EYE TRACKING
Introduction
About Eye Tracking
Eye tracking is the process of measuring either the point of gaze or the motion of an eye relative to the head. (Wikipedia contributors, 2018).
Eye tracking enables researchers detect how long the test subject looks at something, the path their eyes follow, and what point in time they look at it.
In UX design, eye tracking enables designers understand how users view a website, and gives an understanding of how they interpret the visual hierarchy of that site.
History
The earliest attempts at eye tracking began in the 1800s, these attempts involved putting a plaster of Paris covering over the eye with sticks attached pointing outward.
One of the first eye-tracking usability studies was in 1947, when Paul Fitts and his research team used cameras to study the movements of pilots’ eyes while using cockpit controls to land airplanes.
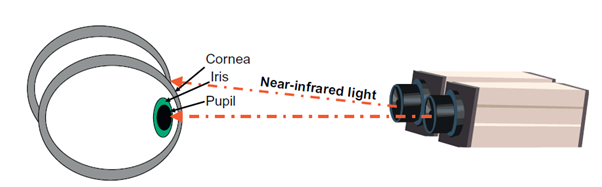
The late 1990s brought about the current-day eye tracker. Most modern eye trackers use on a method called Pupil Center Corneal Reflection (PCCR), to detect and track the location of the eye as it moves. Near-infrared light is directed toward the pupils causing visible reflections in the cornea, which are tracked by a camera (figure 1). (“What is Eye Tracking”, 2016)
Eye tracking has become increasingly popular since, and research has risen from 310 research articles between 1970-74, to 15,000 articles between 2005-09. (“Exponential Growth in Academic Eye Tracking Papers” 2011)
Benefits of eye tracking in usability testing include:
- Learning which areas of the screen attract attention
- Understanding if link labels and instruction text are read
- Creating visuals to convince stakeholders, and defend design decisions
- Providing a triangulation of data with eye tracking visuals, user verbalizations, and overt observed behavior (Romano Bergstrom & Schall, 2014)
Drawbacks include:
- Eye tracking requires additional time and resources at the beginning and end of studies
- Investments in software and hardware methodology
- Possibility of misinterpreting data without using complimentary forms of feedback, like Galvanic Skin Response (GSR) – for example, an optic fixation can indicate either confusion, or an interest in the point of gaze, and they’re both very different emotions.
Methodology
The device used for testing was the Tobii Pro X3-120, and Tobii Pro Studio was used to design tasks and analyse results. Six participants were tested.
There were some minor hardware problems initially, the location of the eye tracker device, was blocking the Wi-Fi signal, and the device slipped on occasions, causing the loss of calibration.
Participants had two goal-directed tasks, both on the Parkrun.ie homepage:
- Task 1 – Find and click the Register link
- Task 2 – Find and click the Login button
The aim of the study was to discover if the redesigned page improved the discoverability of these components.
The output from tests focused on analysing the UI heatmap, the gaze plots , clusters, time to first fixation, and time to first mouse click.
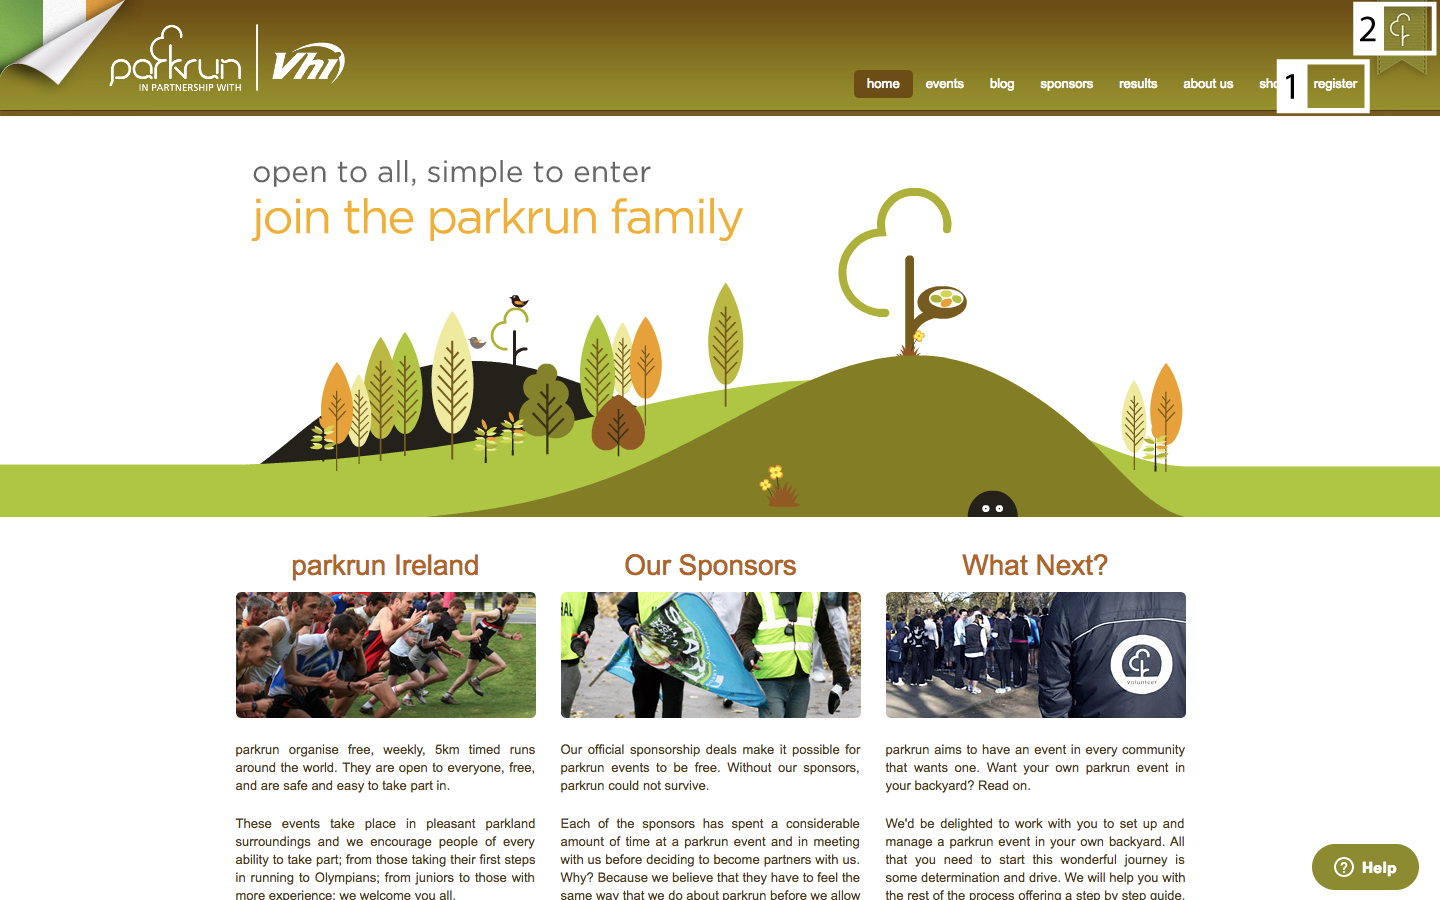
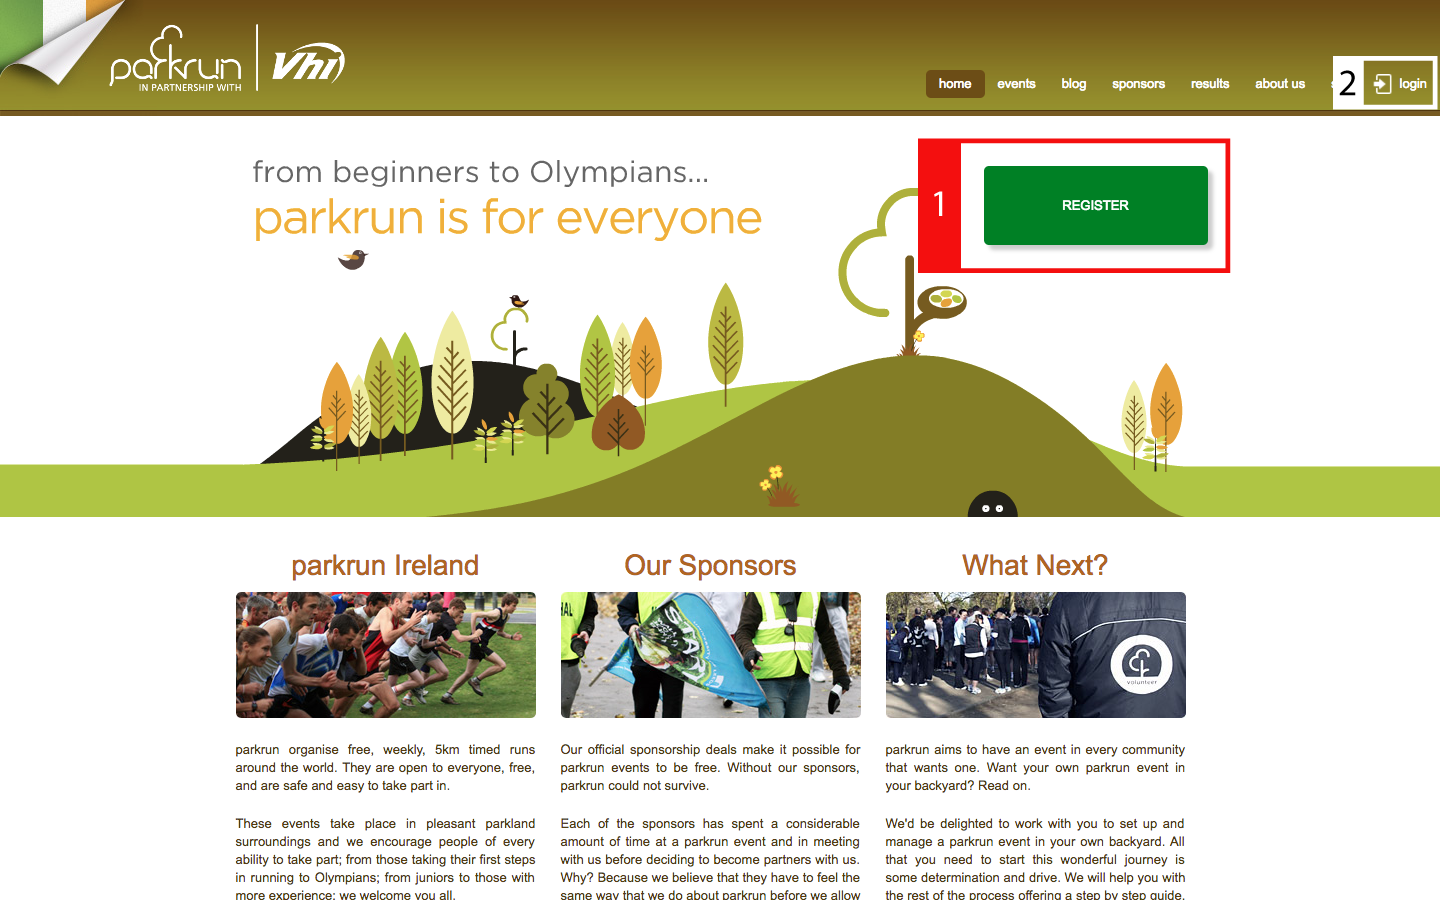
Two variants of the homepage were tested – version one (figure 2), the current homepage, and version two (figure 3), the redesigned page.
Results & Analysis
Gaze Plots
Gaze plots are a numbered, step-by-step, visual representation of fixations and saccades (Romano Bergstrom & Schall, 2014). They are useful for understanding how the subject perceives the visual hierarchy of the scene. Clustering of fixations can indicate the user deliberately viewed something, making it more likely their brain processed that object, it can also indicate confusion (Poole & Ball, 2005). A path of erratic fixations can indicate a lack of a clear visual hierarchy, and regressive saccades can indicate confusion, or lack of salience in content.
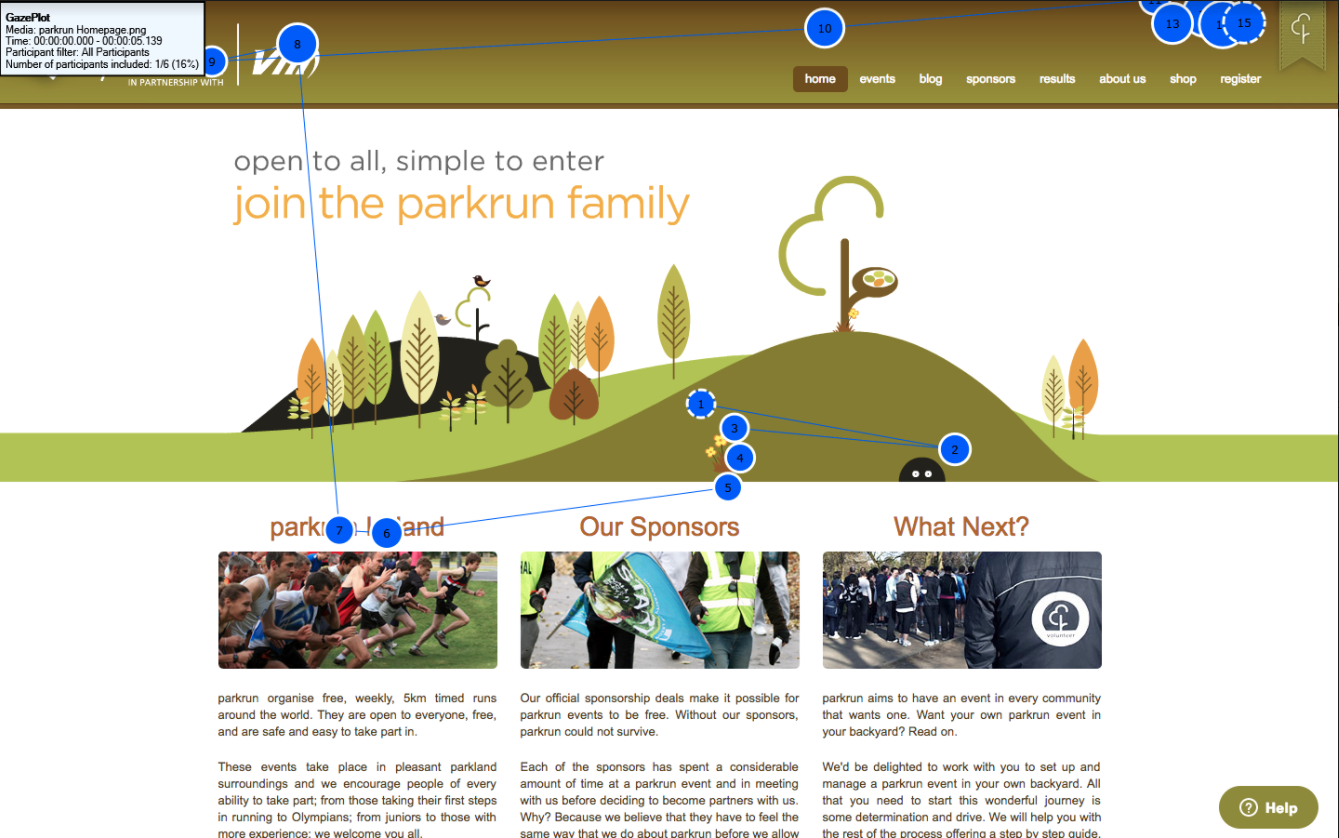
In the scanning phase the user entry-point is close to the centre of the page, the test subject moved to the page header, scanning the global navigation, before identifying the location, with a cluster of fixations.
The cluster appears to be above the Register link, suggesting calibration may have been incorrect, or the subject may have adjusted their seating position.
In the redesigned page the test subject’s entry point is almost identical, the second fixation begins to follow the path of the previous test, however the subject notices and fixates on the new Register button in only three more fixations.
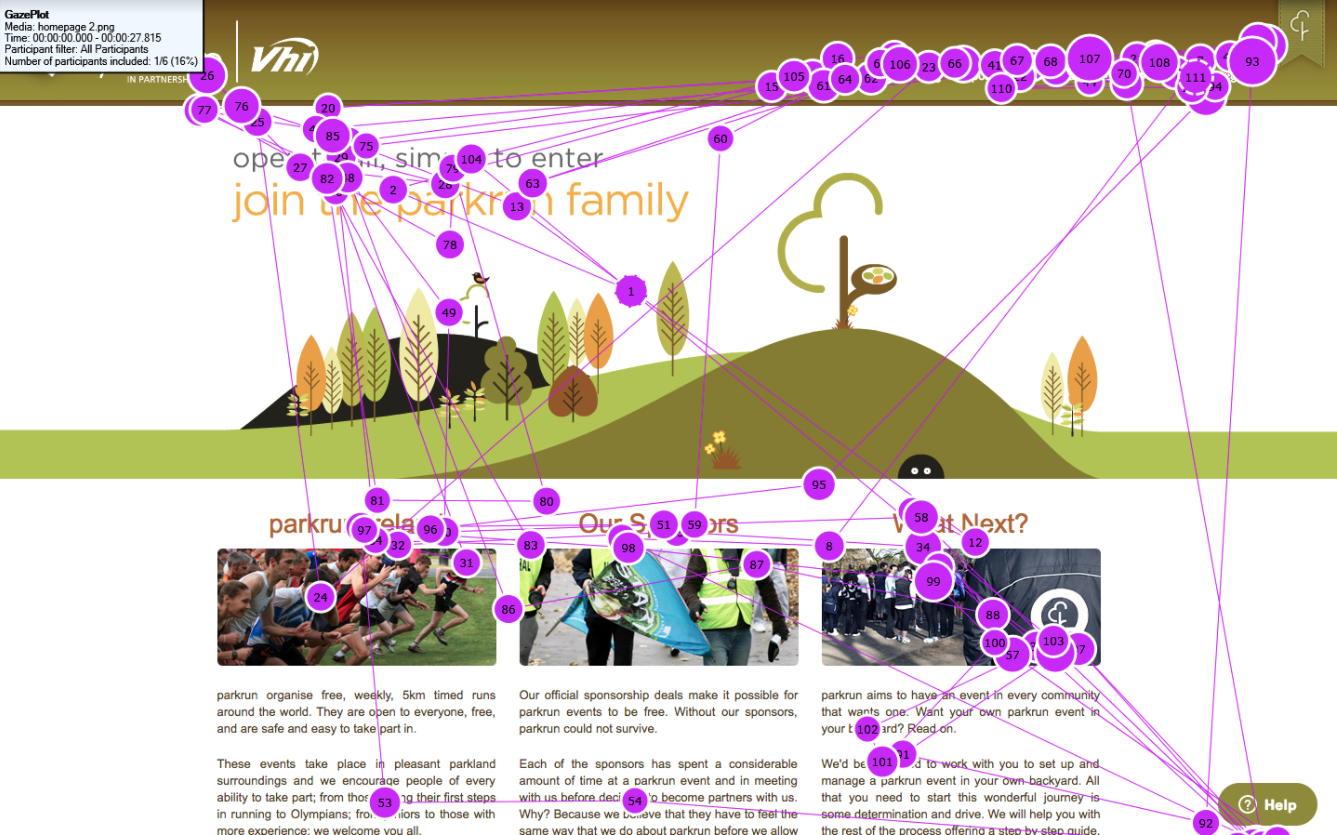
In this test, the erratic gaze plot, and regressive saccades, indicate confusion (Mitzner et al., 2010; Olmsted-Hawala, Romano Bergstrom & Rogers, 2013), the Login icon, a small tree, is not salient, and is not a metaphor associated with logging in. All, but one, test subjects failed to identify it.

In the redesigned version, the more familiar door metaphor is used, along with a Login label. The test subject quickly identifies it and fixates. In this version there is almost no regression and the login is identified in 10 fixations.
Heatmaps
Heatmaps indicate the amount of fixations participants make or for how long they fixate on areas of a page. Fixations are registered using foveal vision for time periods of between 100 and 600 milliseconds (Romano Bergstrom, Schall, 2014)
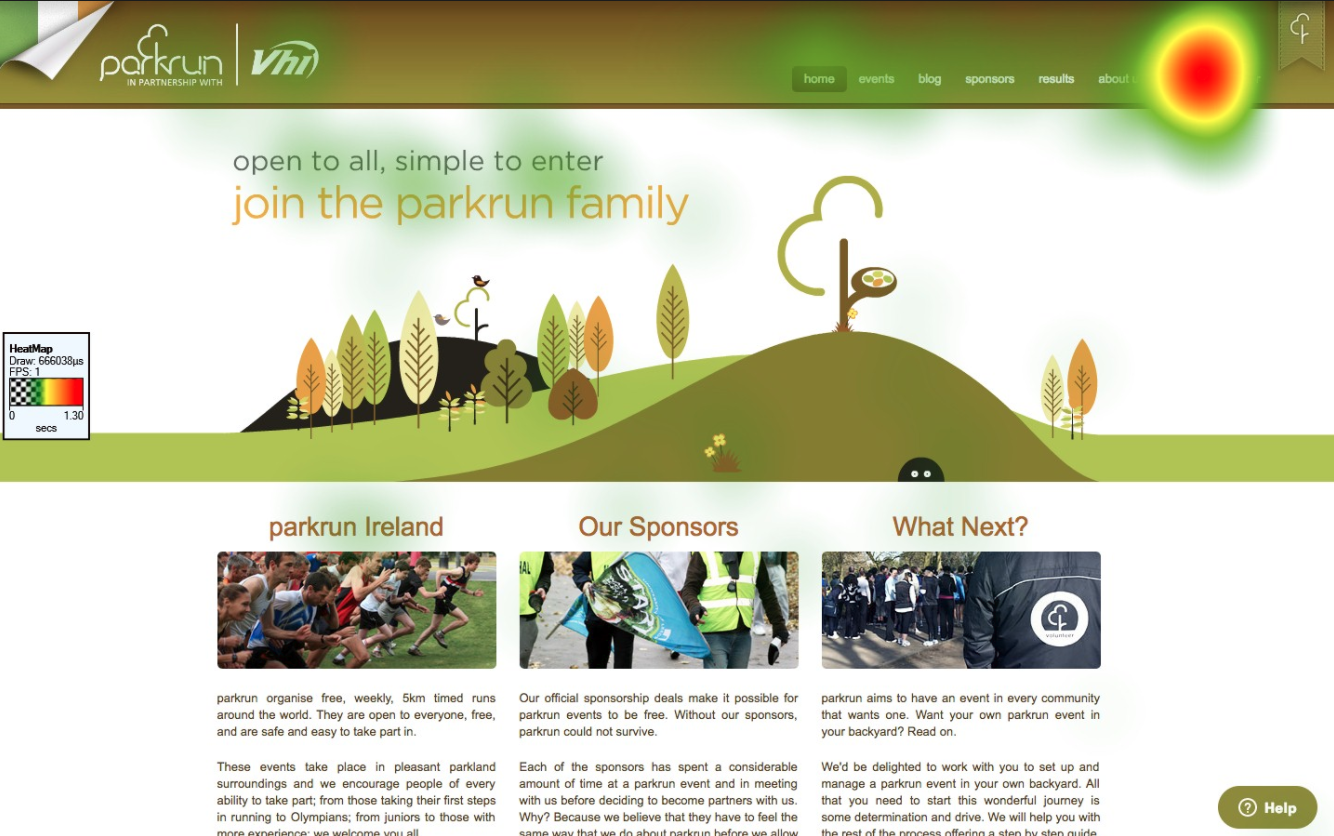
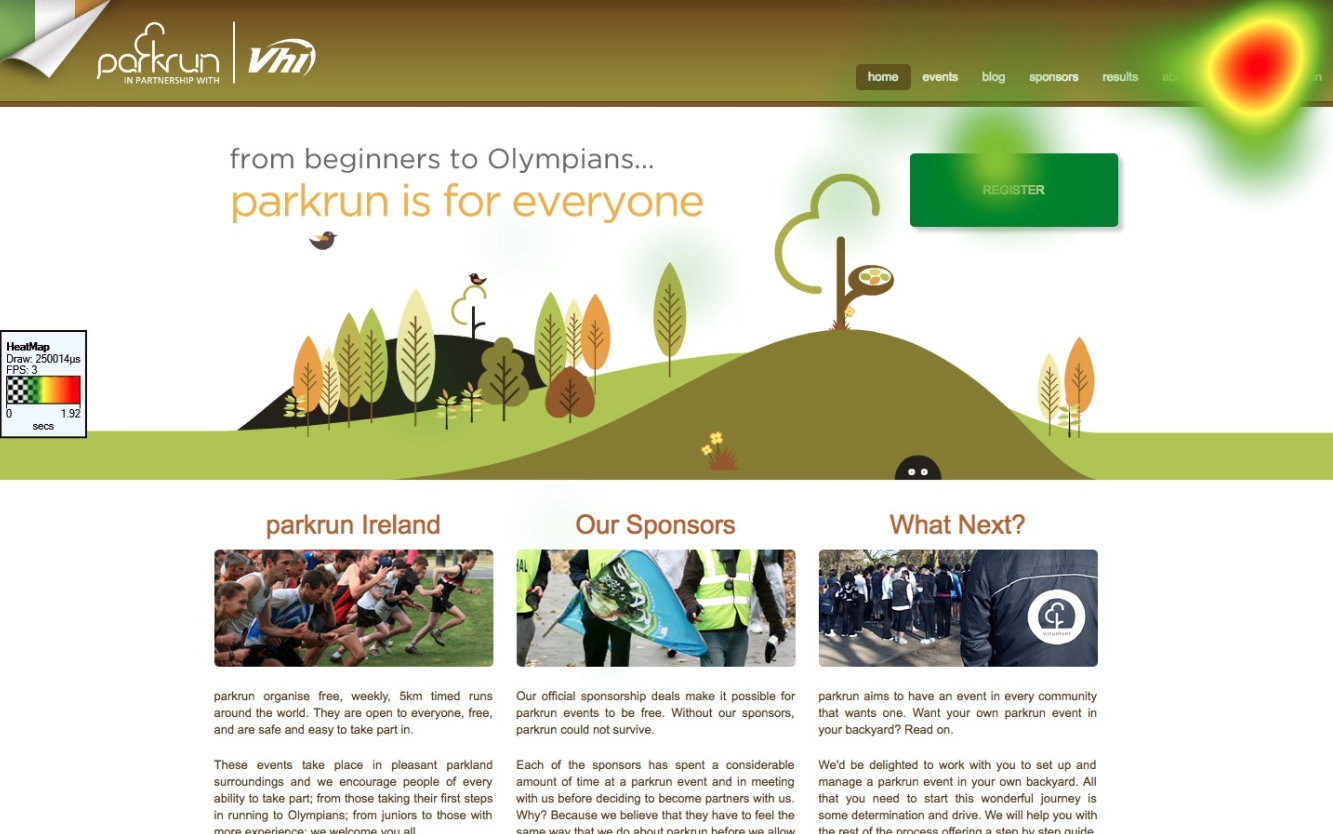
The heatmap for all participants, for Task 1 indicates the participants scan headings and subheadings. Participants also scanned the global navigation, and the Login link was viewed for the longest duration.

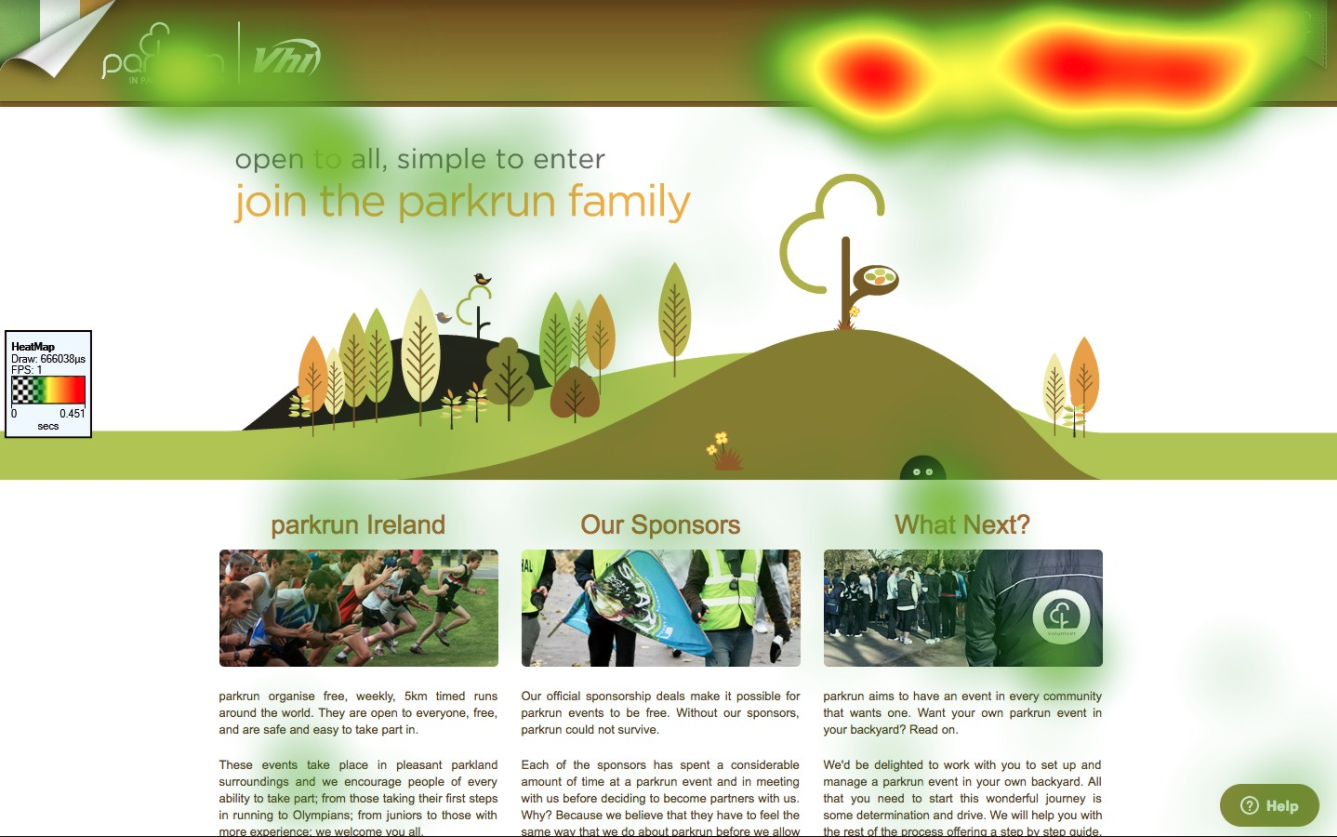
In the redesigned page, participants again scanned the heading, but, unlike in the first test, the global navigation got little attention, and the bigger Register button got longer fixations.
The heatmap indicates longer fixations on headings, and on the global navigation, where, based on established design patterns, a user may expect to find a Login. However almost all of the page receives fixations, including periods of gazing on the Help button on the bottom right-hand-side. This erratic pattern indicates subjects were scanning the entire page, trying to complete the task.
On the redesigned version of the page we see a smaller area of prolonged fixations. Participants, with little fixating on other areas, identify the correct location in the top right-hand corner. The only other area receiving noteworthy attention is the call-to-action (CTA) button, perhaps due to its visual weight.
Clusters
Clusters are regions of a page where there are three or more gaze points at the same time.
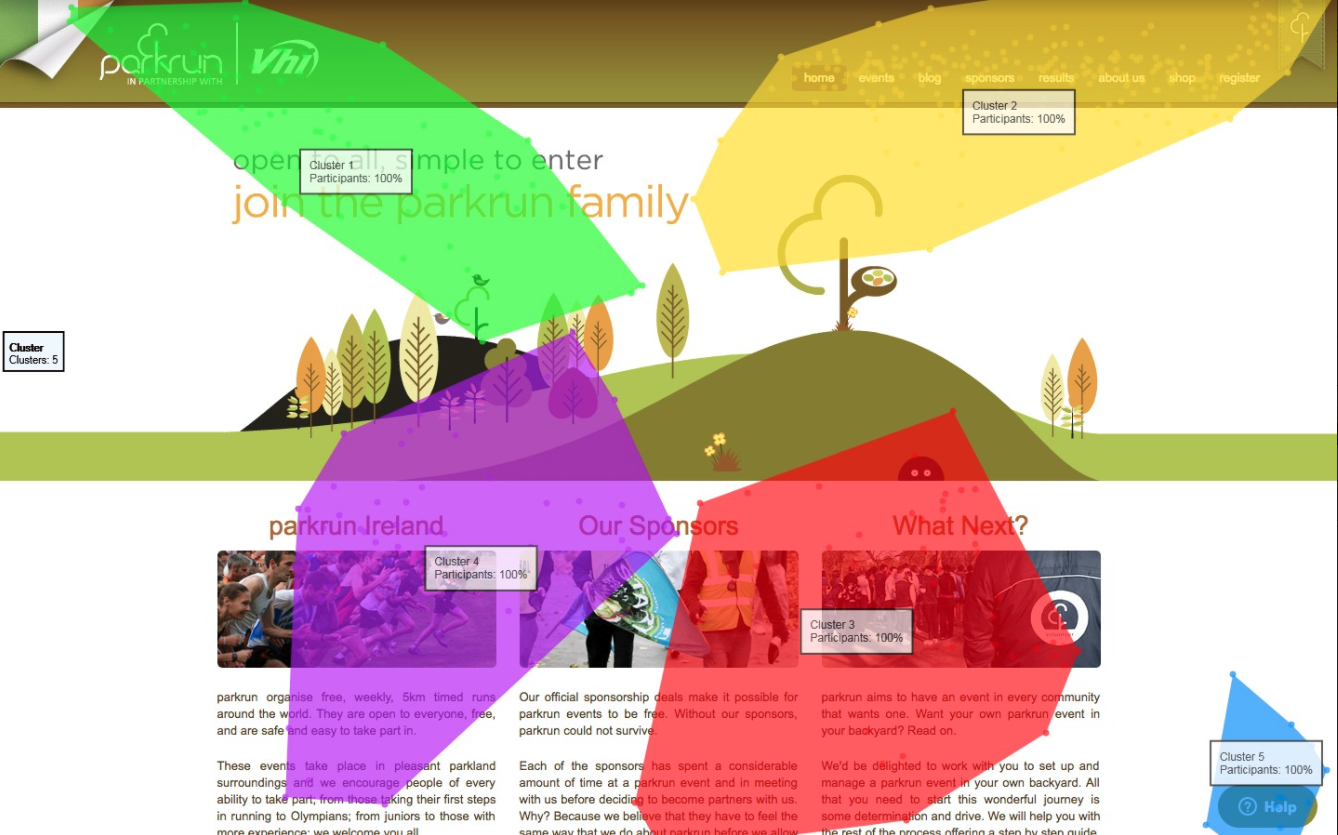
In the current version of the page, for Task 1, we see three clusters, viewed by 100% of participants. All three clusters are over, or bordering content.
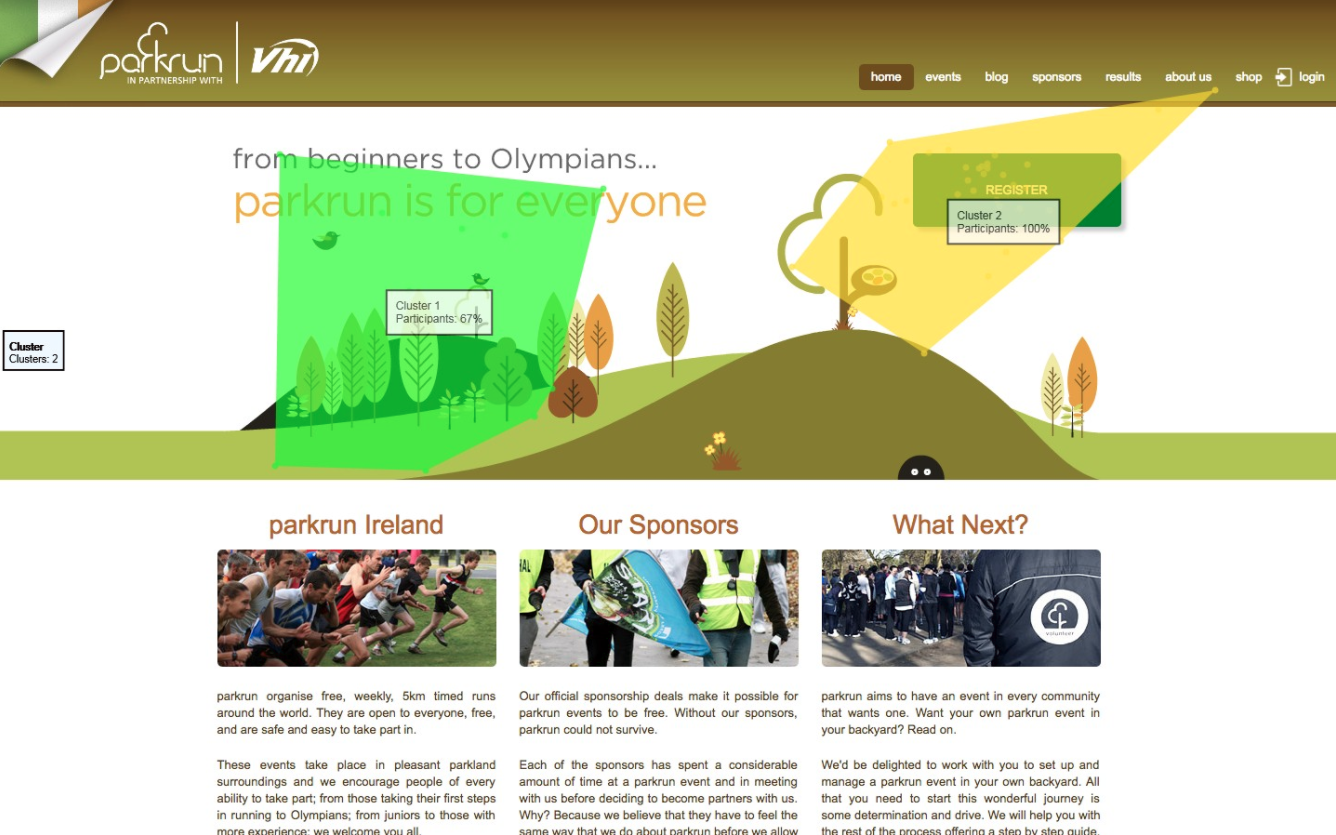
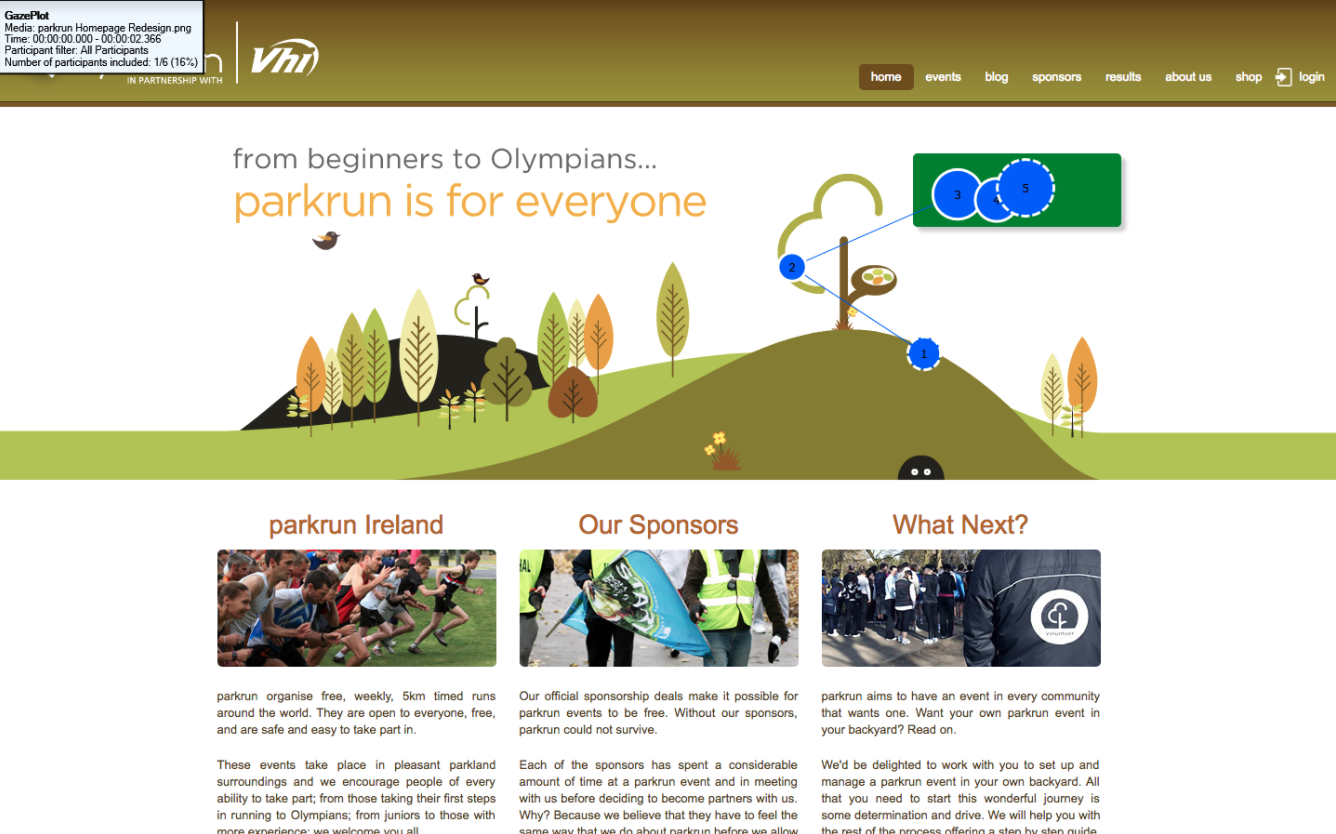
In the redesigned page we have only two clusters, indicating less scanning by participants. Cluster 2, which is the area of the Register button, was viewed by 100% of participants, compared to 67% who viewed Cluster 1. The reduced number of clusters, with the reduced percentage of participants in Cluster 1, indicate the redesign of the Register button increased findability.
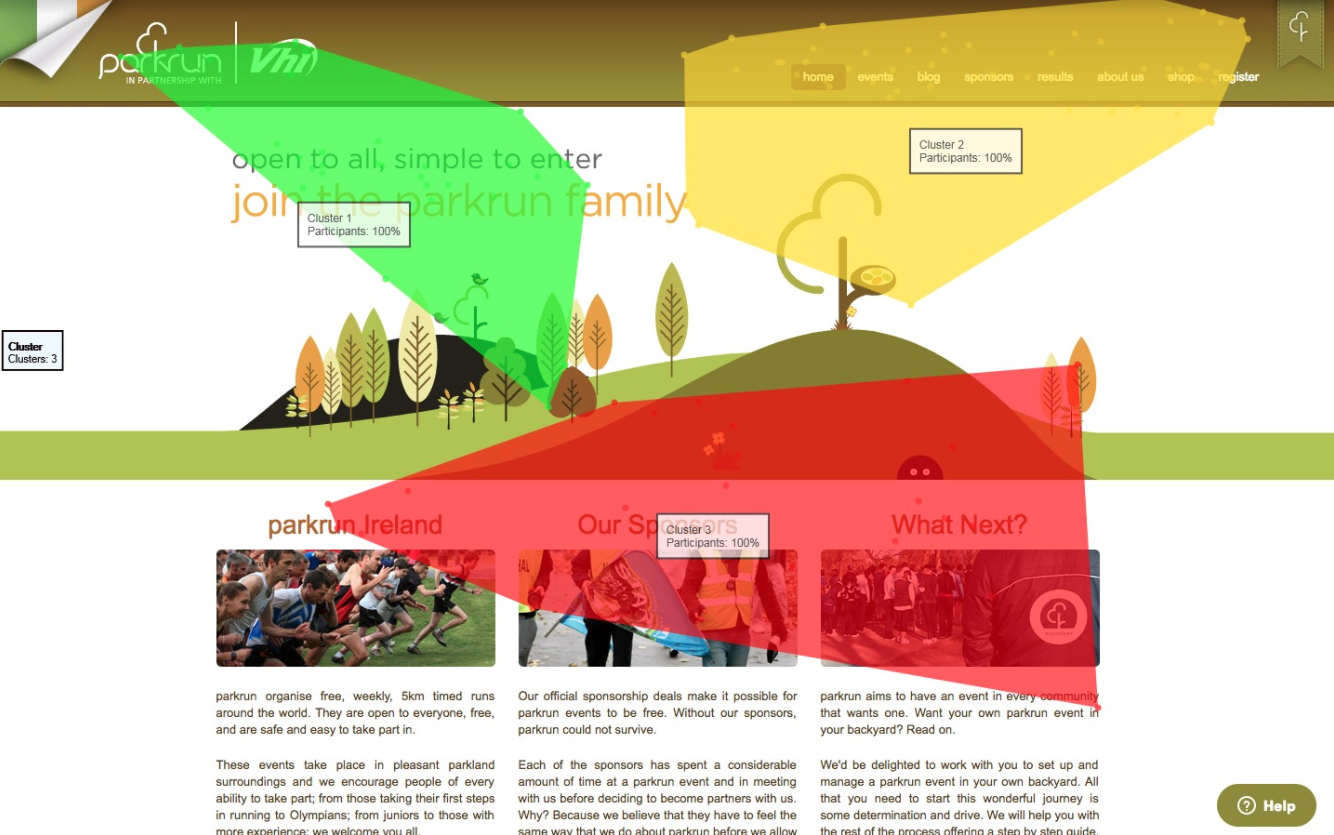
In this task, to click the Login button, there are five clusters, all have been viewed by 100% of participants, indicating participants scanned the entire page looking for the login button.
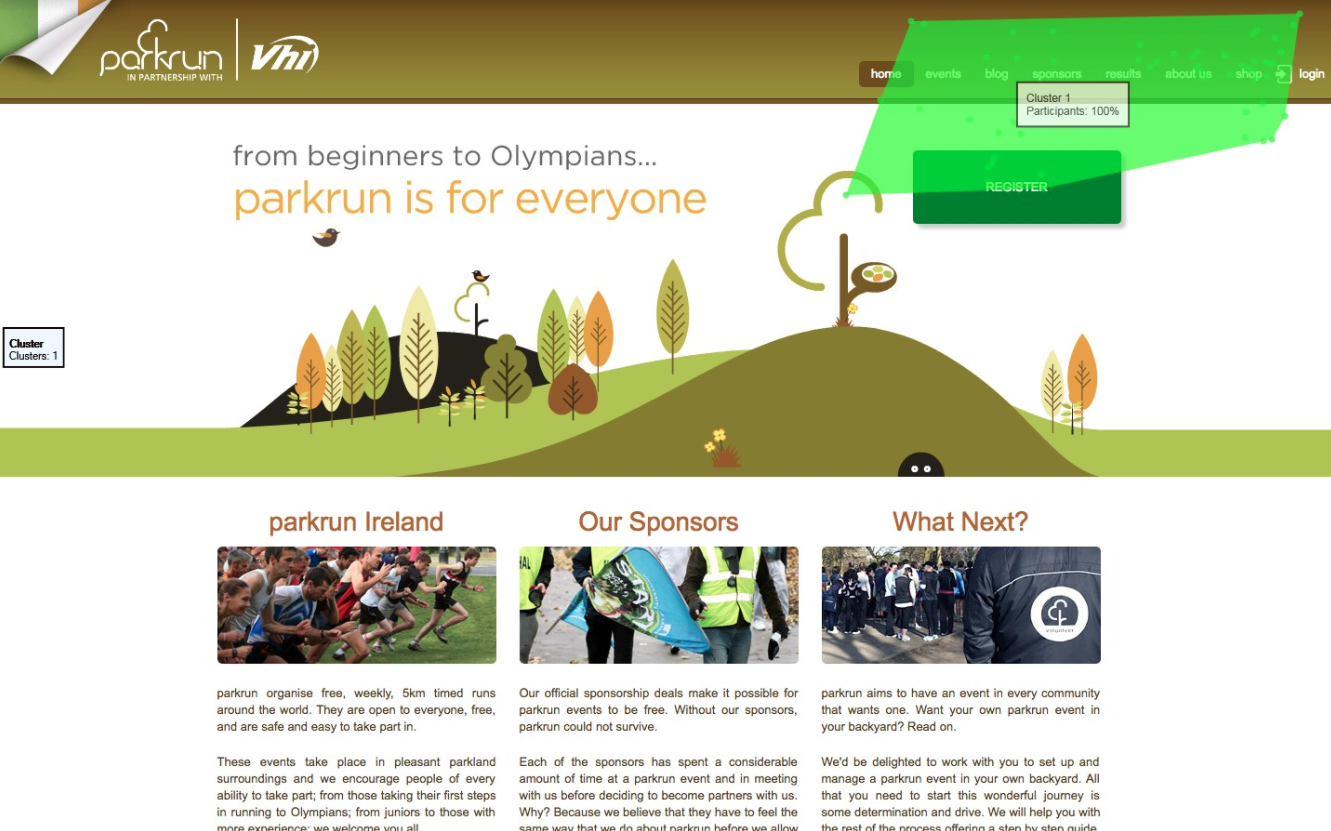
Contrasting the current version of the homepage, which had five clusters, viewed by 100% of participants, the redesigned version only has one cluster in the region of the Login area, viewed by 100% of participants.
Time to First Fixation Mean
The time to first fixation measures the time it takes a participant to look at a specific area of interest (AOI) from the beginning of the test.
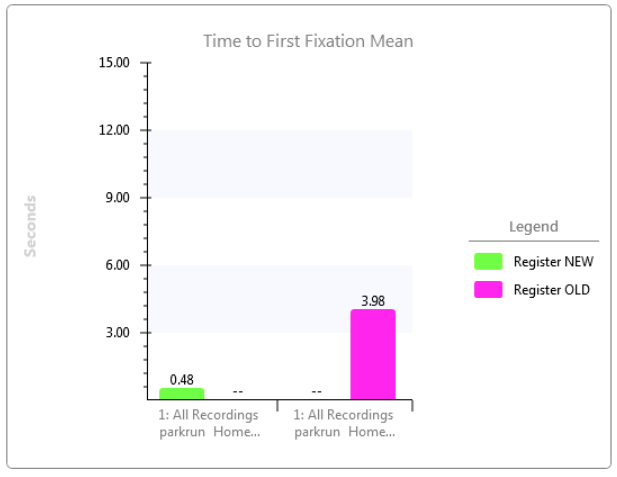
In the current version of the page mean time to fixation on the Register button is 3.98 seconds, compared to .48 seconds in the redesigned version, indicating a 87.94% reduction in the amount of time taken to complete the task.
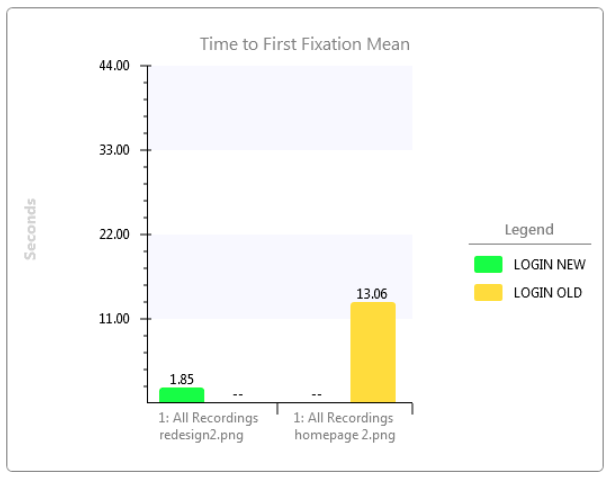
For Task 2, the participant was required to find the login button. Mean time to first fixation, on the current homepage was over 13 seconds (in fact only one participant actually correctly identified the button) compared to 1.85 seconds in the redesigned version, indicating a 85.83% reduction in time taken to complete the task.
Time to First Mouse Click

In Task 1, the mean time to first mouse click was 6.03 seconds on the current design, on the redesigned page it was reduced to 2.57 seconds. indicating a 57.38% decrease in time taken to complete the task.
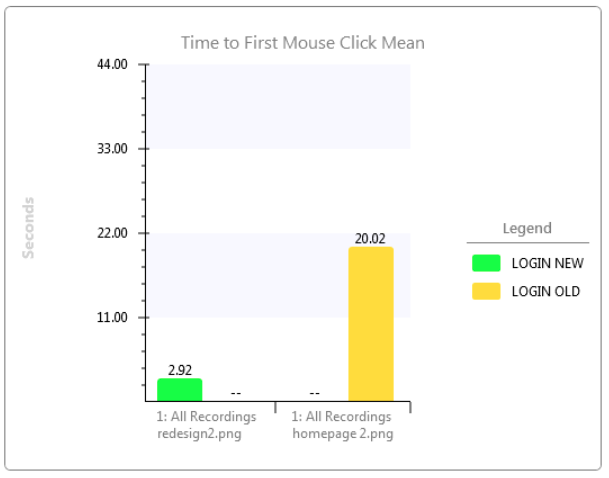
In Task 2, mean time to first mouse click was 22.03 seconds on the current design, on the redesigned version it was reduced to 2.92 seconds. indicating a 85.41% reduction in the time taken to complete the task.
Conclusion
It is not recommended to use eye tracking alone to analyse the entire user experience, as, on occasions the subject’s eyes can fixate unintentionally, these orphan fixations mean it is impossible to imply the participant actually saw the target, or that it registered cognitively.
Used with other non-invasive physiological response data, eg. pupil dilation, facial recognition, skin conductance, and neuroimaging, researchers can also measure emotional and cognitive response. However the quantitative data obtained from eye tracking (e.g., number of mouse clicks, fixation duration) add an additional measure of the user experience that is not easily obtained from usability sessions (Romano Bergstrom & Schall, 2014).
The aim of the test was to ascertain whether the redesign of the Register and Login buttons increased their findability. Analysis of the gaze plots, heatmaps, cluster maps and times to first fixation and first mouse click, on the redesigned homepage indicated improvements over the current version.
Besides some initial problems with hardware setup there were no further issues.
Eyetracking is a useful tool to evaluate how test participants see and interact with the page, however it is not going to tell us how the user feels about any other aspect of the user experience. For that reason, if I was to use eye-tracking again, it would be in conjunction with some other form of analysis, or retrospective talk aloud (RTA) feedback.
References
Imotion.com (2015, August 15), Exponential Growth in Academic Eye Tracking Papers over the last 40 years! Retrieved on 23 April 20017 from https://imotions.com/blog/exponential-growth-in-academic-eye-tracking-papers-over-the-last-40-years/
Imotion.com (2016, January 12), What is Eye Tracking and How Does it Work? Retrieved on 23 April 20017 from https://imotions.com/blog/eye-tracking-work/
imotion.com, The complete pocket guide to eye tracking. Retrieved on 23 April 20017 from https://imotions.com/thank-lp-eye-tracking/
Mitzner, T.L., Touron, D.R., Rogers, W.A., Hertzog, C., (2010) Checking it twice: age-related differences in double checking during visual search. In: Proceedings of the Human Factors and Ergonomics Society Annual Meeting, vol. 54. pp. 1326–1330 (18).
Pernice K & Nielsen J, How to Conduct Eyetracking Studies, retrieved on April 15, 2018, from https://www.nngroup.com/reports/how-to-conduct-eyetracking-studies/
Poole, A., Ball, L.J. (2005) Eye tracking in human-computer interaction and usability research: current status and future prospects. In: Ghaoui, C. (Ed.), Encyclopedia of Human Computer Interaction. Idea Group, Hershey, PA, pp. 211–219.
Romano Bergstrom Jennifer, Schall Andrew (2014) Tracking in User Experience Design 1st Edition, retrieved on 1 April 2018 from https://www.amazon.com/Eye-Tracking-User-Experience-Design-ebook/dp/B00J997ME0
Robert J.K. Jacob, Ph.D. Commentary on Section 4. Eye tracking in human-computer interaction and usability research: Ready to deliver the promises. http://www.ergoestudio.com/descargas/eye-tracking_usability_research.pdf
Wikipedia contributors. (2018). Eye tracking. In Wikipedia, The Free Encyclopedia. Retrieved, April 20, 2018, from https://en.wikipedia.org/w/index.php?title=Eye_tracking&oldid=835564820