In the strategise phase, the two research methods chosen include one qualitative and quantitative method, a user survey, and a second qualitative method, user interviews.
For the interviews, a user interview, and also contextual interview were to be performed.
2.1 User Survey – Mobile Bookmarking
2.1.1 Introduction
The three-section survey was a 32 question questionnaire, consisting of both quantitative and qualitative questions. The first section addressed demographics, the second section related to users use of existing technology. The final section was composed of qualitative questions that sought to understand users’ previous experiences, and canvassed for suggestions on how bookmarking could be improved.
The survey was pilot tested by 4 users and any issues highlighted were addressed.
After being reassessed, the survey was circulated via social media – Facebook and Twitter, resulting in a total of 89 responses over a period of five days.
2.1.2 Survey Results
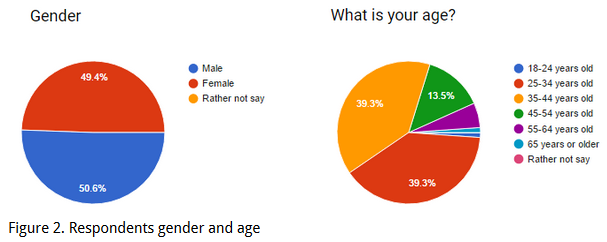
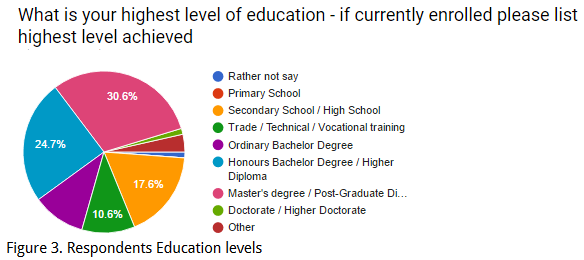
Respondents were equally split, male and female, the majority were third-level educated, between the ages of 25 and 44.
Almost all participants, 98.9% owned a smartphone, 64% had a tablet, and 100% claimed to use the Internet either sometimes or often.
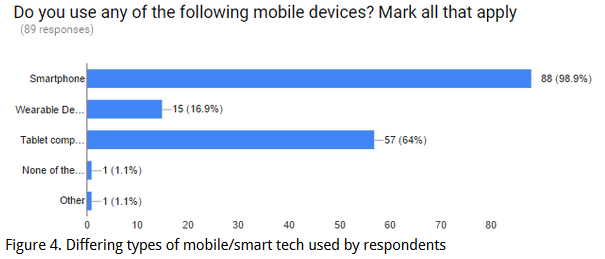
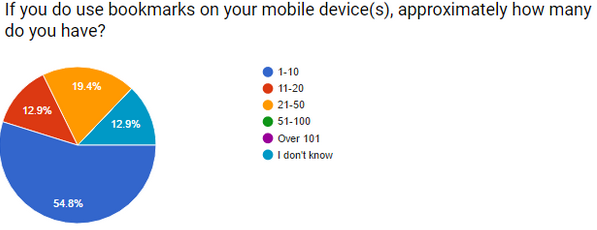
Given such a high percentage of users owned smartphones and tablets, and accessed the Internet sometimes or often, it was noted that 38.1% of participants claimed to never bookmark websites using their mobile devices.
Qualitative feedback from this question included:
“I never considered my mobile as a location to bookmark pages – my work laptop would be the preferred device. I use chrome on my laptop so they wouldn’t sync”
“Never think of it! When you look for something you’ve already looked at, you only have to put in the first couple of letters and you’re back where you wanna be.”
“Don’t understand them”
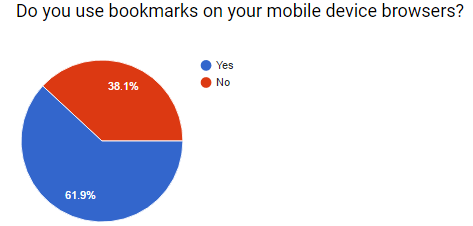
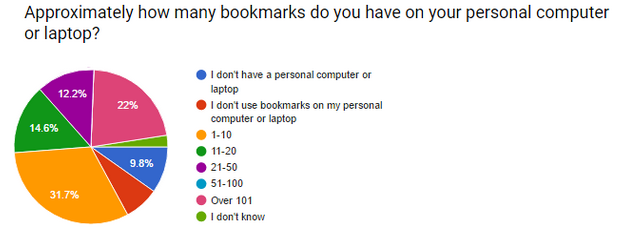
Of the 61.9% of participants who did claim to bookmark on mobile devices, only 14 had over 10 bookmarks, and none of the respondents had over 101. This was in marked contrast to respondents’ behaviour on desktop computers, where 22% of survey participants had over 101 bookmarks.
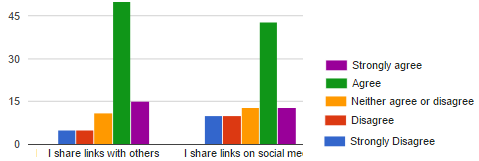
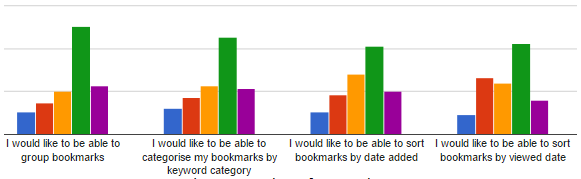
Other noteworthy survey results a included high level of link-sharing, dissatisfaction with current bookmarking processes, and expressing a desire for more sorting and categorisation options.
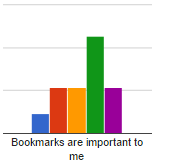
The majority of respondents, 50 in total, indicated that bookmarks were important, or very important, to them.
2.1.3 Analysis Summary & Conclusions
The demographic breakdown of respondents were equally split, male and female, the majority were third-level educated, Internet-savvy and between the ages of 25 and 44. However, with over 70% of the Irish population, now being smartphone owners (Kennedy, J. 2017), the age groups and technical abilities may be attributed to using social networks as the primary means of sourcing survey participants.
Trends emerged from this survey included:
- Convenience – when respondents compared the experience of bookmarking on mobile devices, to desktop computers, the experience on mobile devices was the poorer of the two.
- Categorisation – A large percentage of respondents expressed dissatisfaction at current categorisation techniques, and wished for better options.
- Archiving – Dead links, old links and moved pages were all sources of dissatisfaction for respondents, the status and age of links were also important considerations.
(See Appendix 1 for further respondents’ quotes)
2.2 User interviews
2.2.1 Introduction
The user interviews conducted were individual interviews and contextual interviews.
The individual interview was a one-on-one discussion with a scripted list of 15 questions.
The contextual interviews consisted of two tasks – the first task was to add a bookmark to a new folder, and the second was to retrieve that bookmark and open the link. Consent to record was given by each participant at the start of each interview.
The purpose of the interviews were to examine the user experience, critical incidents (Nielsen J. 2010), the usability of the product, to add further insight to demographic and ethnographic data from the user survey.
2.2.2 Interview Participants
Interview participants were chosen to include users of both of the major mobile operating systems identified in the user survey, iOS and Android. They also fitted the profile of the typical user identified in the user survey.
2.3 Contextual User interview
2.3.1 Introduction
In the contextual interview, participants were assigned two tasks. The most frequently performed tasks identified in the survey – adding and retrieving bookmarks.
2.3.2 Contextual Interview tasks
- The first task, adding a bookmark, required the participant to go to a website, www.cats.com, and bookmark it in a new folder called “animals”.
- The second task asked the user to open a new browser window, find the bookmark created in the previous exercise and open it.
To map the current process, and as an aid to note taking, an As Is process flow was created.
2.3.3 Contextual Interview Recordings
- Participant A Task 1 Contextual Interview
- Participant A Task 2 Contextual Interview
- Participant B Task 1 Contextual Interview
- Participant B Task 2 Contextual Interview
- Participant C Task 1 & Task 2 Contextual Interview
- Participant D Task 1 & Task 2 Contextual Interview
2.3.4 Contextual Interview Task Completion Rates
|
Participant |
Task 1 |
Task 2 |
|
A |
✓ |
✓ |
|
B |
– |
✓ |
|
C |
✓ |
✓ |
|
D |
✓ |
✓ |
|
Completion Rates |
75% |
100% |
Figure 12. Task completion rates in contextual interviews
2.4 Individual User Interviews
2.4.1 Individual User Interview – Participant A
You can listen to the entire interview with Participant A here
2.4.1.1 Analysis Summary & Conclusions
- Participant A uses tabs as temporary bookmarks.
- The subject refers to issues surrounding categorisation / classification of bookmarks, throughout the interview.
- Participant A sometimes photographs web pages, as an alternative to bookmarking.
- The subject suggested automatic archiving of bookmarks would benefit the user.
(See Appendix 2 for interview transcription)
2.4.2 Individual User Interview – Participant B
You can listen to the entire interview with Participant B here
2.4.2.1 Analysis Summary & Conclusions
- Participant B tends to use tabs as temporary bookmarks, he uses his browser’s history as a way of revisiting sites he previously visited.
- Bookmarking seems to be used more of a way to store, or archive a site for possible later access, than a method of cataloguing favourites, it seems to have become a second tier for recording sites of interest.
- The lack of easily accessed categorisation and filtering options impacts the frequency the bookmarks and sites are revisited by the subject, resulting in them being forgotten about.
- Participant B has almost abandoned the traditional means of accessing favourite sites, bookmarking, and replaced it with auto-complete on his browser’s address bar.
- Participant B seems to never use the traditional method of browsing folders for bookmarks, and relies on a combination of memory of the page title or subject matter – and searching his bookmarks based on those memories.
(See Appendix 3 for interview transcription)
2.4.3 Individual User Interview – Participant C
You can listen to the entire interview with Participant C here
2.4.3.1 Analysis Summary & Conclusions
- The subject keeps many work-related tabs open temporarily for easy reference.
- Participant C uses the same browser across devices.
- Participant C mainly bookmarks on desktop, less so on mobile.
- The reason for her not bookmarking, on mobile devices, according to Participant C, is because she really doesn’t know how to, and that she finds the process laborious.
- Participant C loses a lot of her bookmarks due to poor categorisation.
2.4.4 Individual User Interview – Participant D
You can listen to the entire interview with Participant D here
2.4.3.1 Analysis Summary & Conclusions
- Participant D does not tend to bookmark on mobile devices, but does on desktop computers.
- When Participant D does bookmark on mobile devices he tends not to return to them.
- Participant D finds the long page titles that are added as the default bookmark title, unhelpful.
2.5 Affinity Diagrams
Figure 13. Affinity Diagram (view hi-res PDF version)
In order to find meaningful patterns in the qualitative data exposed in the survey and user interviews (Spencer B. 2016), the feedback was gathered and organised it into the logical groups and themes that emerged. This enabled issues to be identified and analysed, and identified the pain points and needs of users. The affinity diagrams were subsequently fed into the personas.